






NTPC 90 GW Commercial Capacity Analysis: Key Findings
NTPC 90 GW Commercial Capacity Analysis examines NTPC Limited’s latest commercial-capacity milestone, renewable-energy expansion, financial performance, and broader power-generation operations.
1. Executive Summary
NTPC Limited (NSE: NTPC, BSE: 532555), established in 1975 and holding ‘Maharatna’ status under the Ministry of Power, Government of India, is India’s largest integrated power generation enterprise. Operating an extensive pan-India generation fleet spanning super thermal coal stations, gas-fired combined-cycle plants, hydro-electric installations, and expanding utility-scale solar and wind complexes, NTPC contributes approximately 24% of India’s total electricity generation while accounting for roughly 17% of the nation’s total installed power capacity.
In recent quarters, capital markets and institutional investors have focused on NTPC’s dual-track operational strategy: running its baseload coal-fired power stations at higher-than-average Plant Load Factors (PLFs) to ensure grid reliability during peak demand cycles, while aggressively channeling internal cash flows into non-fossil assets through its clean energy vehicle, NTPC Green Energy Limited (NGEL). In its latest financial statements, filed with the National Stock Exchange of India (NSE)
and accessible via the NTPC Investor Relations Portal
, the utility reported consolidated quarterly revenue from operations of ₹51,141.51 crore and a consolidated quarterly net profit of ₹6,721.05 crore for Q1 FY27, backed by operating EBITDA margins of ~33.5% and a total generation output exceeding 110 billion units for the quarter.
| Core Financial & Operational Metric | Reported Benchmark / Reading | Operational & Regulatory Context |
| Quarterly Revenue from Operations (Q1 FY27) | ₹51,141.51 Crore | +7.8% YoY driven by peak summer dispatch demand |
| Quarterly Consolidated Net Profit (PAT) | ₹6,721.05 Crore | +11.8% YoY supported by lower fuel cost variations |
| Consolidated Operating EBITDA | ₹17,151.20 Crore | Operating margin standing at 33.5% |
| Group Total Installed Capacity | 91,086 MW | Largest power producer on the Indian subcontinent |
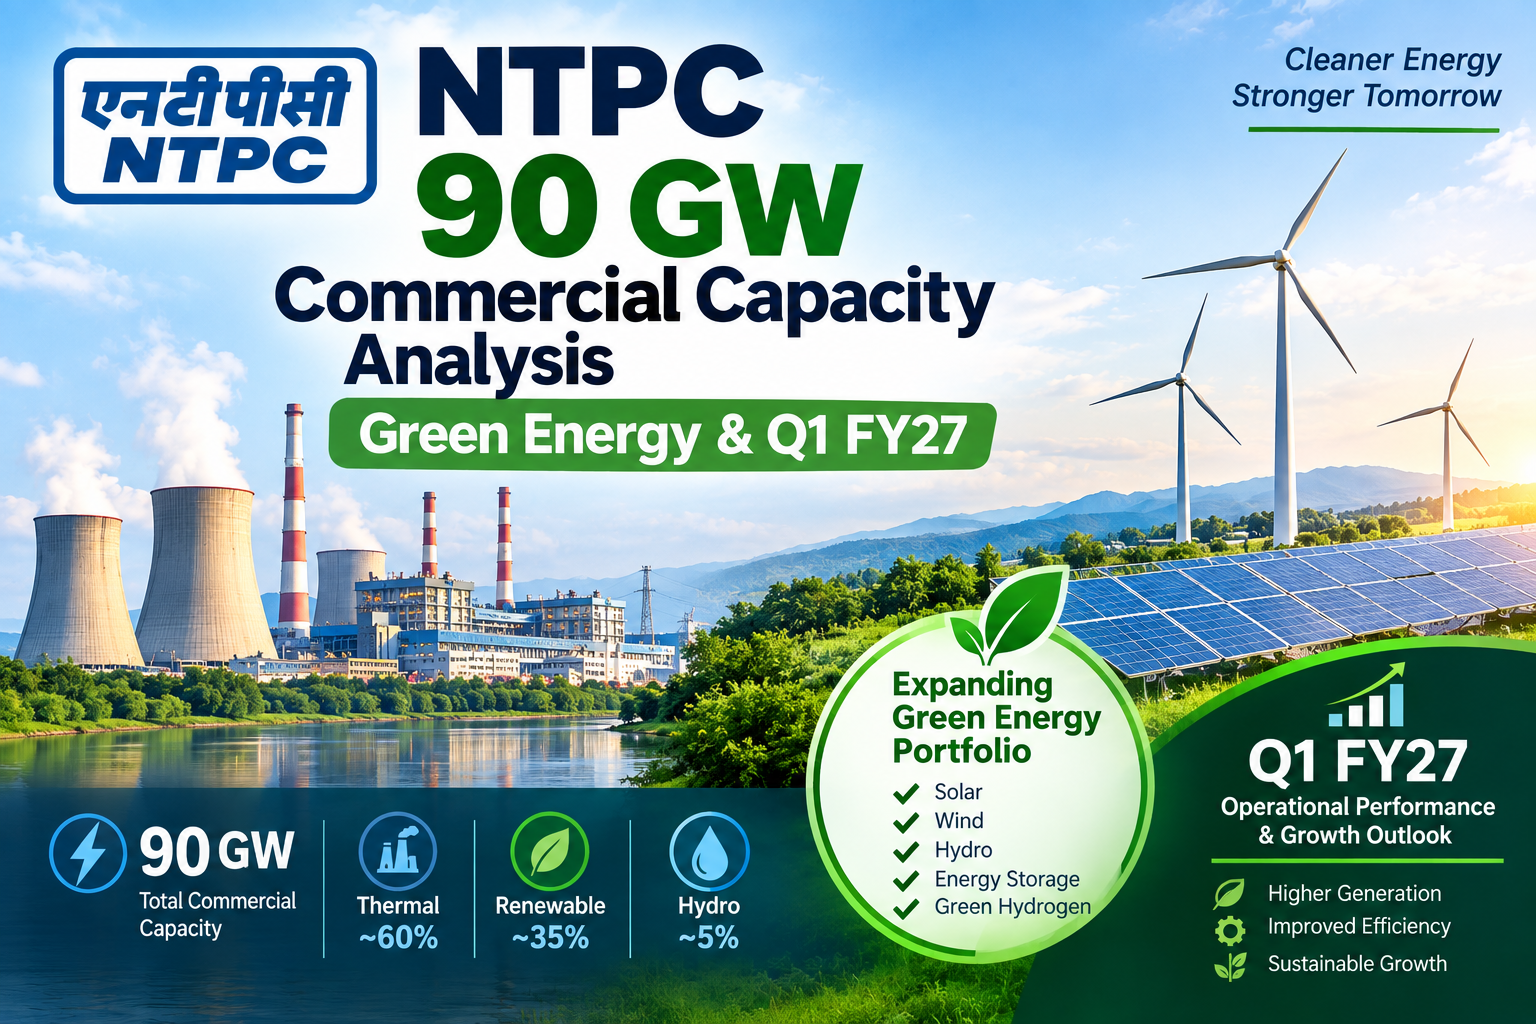
| Group Total Commercial Capacity | 90,006 MW | Historic milestone crossing 90 GW commercial threshold |
| Market Capitalization | ~₹3,19,505 Crore | Anchor blue-chip utility in the NIFTY 50 index |
| Price-to-Earnings (P/E TTM) | 11.64x – 13.60x | Significant valuation discount to private clean energy peers |
| Price-to-Book (P/B) | 1.57x – 1.85x | Backed by tangible book value of ~₹210 per equity share |
| Equity Dividend Yield | 2.70% – 2.73% | Consistent annual payout backed by regulated cash flows |
| Return on Equity (ROE) | 13.9% – 15.1% | Anchored to CERC 15.5% post-tax normative equity return |
| Average Coal Plant Load Factor (PLF) | 72.04% | Outperforms the national thermal average (~63%–65%) |
Table of Contents
2. Why This Stock Is In Focus Today
Official Corporate Announcement Details
- Announcement Date:September 12, 2026
- Company / Symbol:NTPC Limited (
NTPC) - Filing Reference:
Ref. No.: 01:SEC:LA:1 Dated: 12th September 2026 - Subject: Regulatory disclosure under Regulation 30 of SEBI (Listing Obligations and Disclosure Requirements) Regulations, 2015 intimating the declaration of Commercial Operation Date (COD) for the second part capacity of 6.3 MW of the Vanki Wind Energy Project in Nakhatrana, Kutch, Gujarat, taking total NTPC Group installed capacity to 91,086 MW and commercial capacity to 90,006 MW effective September 13, 2026.
- Clickable PDF Link:Download NTPC September 12, 2026 Announcement PDF
- Direct Raw URL:
[https://nsearchives.nseindia.com/corporate/NTPC_12092026170051_20260912_STEX_NGELCOMMISSIOING.pdf](https://nsearchives.nseindia.com/corporate/NTPC_12092026170051_20260912_STEX_NGELCOMMISSIOING.pdf)
+---------------------------------------------------------------------------------------------------+
|                        OFFICIAL REGULATORY INTIMATION SUMMARY: SEPTEMBER 12, 2026                 |
+---------------------------------------------------------------------------------------------------+
| - Regulatory Authority: SEBI (LODR) Regulations, 2015, Regulation 30                              |
| - Project Intimated: Vanki Wind Energy Project, Nakhatrana, Kutch, Gujarat                        |
| - Executing Subsidiary: NTPC Renewable Energy Limited (via NTPC Green Energy Limited - NGEL)     |
| - Incremental Operational Capacity: 6.3 MW (Part-II COD, expanding from 50.4 MW in July 2026)    |
| - Effective Commercial Operation Date: 00:00 hrs. of September 13, 2026                          |
| - Milestone Group Installed Capacity: 91,086 MW (91.08 GW)                                        |
| - Milestone Group Commercial Capacity: 90,006 MW (Crossing the 90 GW Commercial Benchmark)        |
| - Strategic Takeaway: Continuous quarterly commercialization of captive green energy assets      |
+---------------------------------------------------------------------------------------------------+
Strategic Significance of the 90 GW Operational Benchmark
The September 12, 2026 regulatory disclosure marks an important operational milestone:
- Commercial Capacity Crosses 90,000 MW: Achieving 90,006 MW of active commercial capacity solidifies NTPC’s position among the ten largest power generation utilities globally, providing scale benefits in equipment procurement, fuel sourcing, and debt syndication.
- Execution Pace at NGEL: The commissioning of the incremental 6.3 MW tranche at the Vanki Wind site in Kutch follows the 50.4 MW commercialization declared earlier this fiscal year. This highlights NGEL’s modular commissioning model, turning capital work-in-progress into tariff-earning assets without waiting for entire multi-hundred-megawatt projects to reach completion.
- Renewable Energy Expansion: NGEL’s total commercial operational capacity now stands at 10,842.86 MW, providing cash-flow support as it progresses toward its broader multi-year target of 60 GW of renewable energy by 2032.
3. Stock Market Analysis Today: India Context
India’s power sector is experiencing structural demand growth driven by three fundamental forces:
- Rising Industrial & Residential Power Consumption: National peak power demand consistently surpasses 250 GW, driven by rising industrial manufacturing output, state-level electrification initiatives, and rapid air-conditioning adoption. This requires higher round-the-clock baseload generation to maintain grid frequency stability.
- The Basal Grid Balancing Mandate: As intermittent solar and wind capacity scales across the national transmission grid, thermal plants with flexible ramp-up capabilities are essential for night-time peak balancing. NTPC’s modern supercritical thermal units act as the country’s primary baseload anchor.
- Coal Supply Chain Stability via Captive Mining: The Ministry of Coal and Indian Railways have prioritized coal supplies to power stations. NTPC’s captive coal mines produced over 35 million tonnes annually in recent years, insulating its generation units from international seaborne coal price spikes.
4. Business Model Deep Dive
NTPC generates revenue through three core operational pillars:
+-----------------------------------------------------------------------------------+
|                            NTPC GROUP BUSINESS ARCHITECTURE                       |
+---------------------+---------------------+-------------------+-------------------+
| Regulated Thermal   | NTPC Green Energy   | Captive Mining &  | Trading, Nuclear  |
| Generation (Baseload|  (NGEL Clean Fleet) | Fuel Security     | & Consulting      |
|  - ~88% Revenue     |  - 10.8+ GW Comm.   |  - Pakri-Barwadih |  - NVVN Trading   |
|  - CERC Two-Part    |  - Solar, Wind, BESS|  - Chatti-Bariatu |  - ASHVINI JV     |
|    Fixed Capacity   |  - Target: 60 GW    |  - 35+ MT Annual  |  - International  |
|    Tariff Structure |    by FY32          |    Captive Coal   |    Advisory       |
+---------------------+---------------------+-------------------+-------------------+
A. Regulated Thermal Power Generation (~88% of Sales)
Governed by the Central Electricity Regulatory Commission (CERC) multi-year tariff framework, which utilizes a two-part tariff mechanism:
- Capacity (Fixed) Charge: Covers debt service, depreciation, operational expenses, and a guaranteed post-tax Return on Equity (ROE) of 15.5%, payable by state utilities so long as plant availability meets or exceeds the normative threshold (typically 85%).
- Energy (Variable) Charge: Directly passes through actual fuel costs (coal and transportation) on a per-kilowatt-hour basis, protecting operating margins from domestic and imported coal price inflation.
B. NTPC Green Energy Limited (NGEL)
A dedicated, wholly owned clean-energy subsidiary managing operational solar, onshore wind, hybrid, and battery energy storage systems (BESS). Capacity has crossed 10.8 GW, supported by 25-year Power Purchase Agreements (PPAs) signed with central intermediaries like SECI and creditworthy industrial counterparties.
C. Captive Coal Mining & Logistics
Operates major captive mining blocks (including Pakri-Barwadih, Dulanga, Talaipalli, and Chatti-Bariatu) with annual dispatches exceeding 35 million tonnes, reducing reliance on third-party supply chains and lowering generation costs.
D. Power Trading, Nuclear Energy & International Joint Ventures
Through subsidiary NTPC Vidyut Vyapar Nigam (NVVN), the group trades surplus power, while ASHVINI (a joint venture with Nuclear Power Corporation of India) is pursuing fleet-mode development of pressurized heavy water nuclear reactors.
5. 7 Powerful Growth Drivers Behind NTPC
1. Capitalization of the 35.7 GW Ongoing Project Pipeline
NTPC maintains an active construction pipeline of nearly 35.7 GW spanning advanced ultra-supercritical coal units, pumped storage hydro schemes, and large-scale solar projects. As these units achieve Commercial Operation Dates, they systematically expand the regulated equity base that drives profit after tax.
2. The 60 GW Renewable Capacity Roadmap by 2032
Through NGEL, NTPC is targeting 60 GW of renewable energy by 2032. Developing mega clean-energy complexes like the 4.75 GW Khavda Renewable Park in Gujarat provides steady top-line growth opportunities.
3. Thermal Fleet Efficiency and High Plant Load Factors (72%+)
NTPC’s coal-fired stations achieve an average plant load factor exceeding 72%, substantially above the national utility average. This operational efficiency qualifies plants for supplementary CERC availability incentives.
4. Expansion of Low-Cost Captive Coal Production
Ramping up annual captive coal extraction toward 50 million tonnes lowers the fuel component of variable energy charges, making NTPC’s electricity tariffs among the most competitive on the national Merit Order Dispatch stack.
5. Nuclear Power Commercialization via the ASHVINI Alliance
Collaborating with NPCIL to construct nuclear power projects (such as Mahi Banswara in Rajasthan) positions NTPC to provide non-fossil baseload power over the long term.
6. Development of Pumped Hydro and Battery Storage Solutions
To mitigate clean-energy intermittency, NTPC is building off-river pumped storage hydro facilities across central and southern India, positioning itself to supply lucrative round-the-clock (RTC) green power.
7. Balance Sheet Deleveraging and High Dividend Distributions
Generating over ₹35,000 crore in annual cash flow from operations allows NTPC to internally fund a substantial share of its capital outlays while sustaining an equity dividend yield near 2.7%–2.8%.
6. Industry Analysis & Peer Benchmarking
The Indian power generation landscape features distinct public and private operating models:
| Generation Enterprise | Market Cap (₹ Cr) | Group Installed Capacity (MW) | Operating EBITDA Margin (%) | P/E Ratio (TTM) | Dividend Yield (%) |
| NTPC Limited | ₹3,19,505 | 91,086 MW | ~33.5% – 35.0% | 11.6x – 13.6x | ~2.70% – 2.73% |
| Adani Green Energy | ~₹2,02,000 | ~11,200 MW (Pure RE) | ~68.0% – 72.0% | ~108.8x | 0.00% |
| JSW Energy | ~₹92,000 | ~7,800 MW | ~36.0% – 38.0% | ~48.1x | ~0.38% |
| NHPC Limited | ~₹76,000 | ~7,100 MW (Hydro) | ~52.0% – 55.0% | ~20.2x | ~2.11% |
Data compiled from corporate exchange reports on NSE India
and Screener Consolidated Utilities Profile
7. Competitive Moat Analysis
- Regulatory Tariff Pass-Through Protection: CERC regulations guarantee a 15.5% post-tax return on equity and pass through fuel costs, insulating operating cash flows from input price swings.
- Merit Order Dispatch Leadership: Delivering power at average tariffs between ₹3.80 and ₹4.20 per unit places NTPC at the top of state load dispatch merit orders, ensuring its plants are dispatched ahead of higher-cost private or merchant facilities.
- Site, Water, and Ash Disposal Clearances: Building large-scale thermal and hydro stations requires extensive environmental, land, and water rights. NTPC’s existing plant footprints offer brownfield expansion opportunities at lower capital costs than greenfield assets.
- Low Sovereign Borrowing Costs: Backed by 51.10% Government of India ownership and top domestic credit ratings (CRISIL / ICRA AAA), NTPC accesses wholesale debt markets at yields close to benchmark government securities.
8. Multi-Year Financial Performance Analysis
Audited consolidated financial statements demonstrate stable revenue growth and margin durability:
| Metric (Consolidated) | FY23 Reported | FY24 Reported | FY25 Reported | FY26 Reported | Q1 FY27 Reported |
| Revenue from Operations (₹ Cr) | 1,76,207 | 1,81,166 | 1,86,500 | 1,93,200 | 51,142 |
| Operating EBITDA (₹ Cr) | 48,250 | 52,140 | 54,800 | 58,400 | 17,151 |
| EBITDA Margin (%) | 27.4% | 28.8% | 29.4% | 30.2% | 33.5% |
| Consolidated Net Profit (PAT ₹ Cr) | 17,197 | 21,332 | 22,450 | 24,100 | 6,721 |
| Annual Electricity Generation (BU) | 399 BU | 422 BU | 428 BU | 432 BU | ~112 BU |
| Dividend Per Share (DPS ₹) | 7.25 | 7.75 | 8.25 | 8.75 | Interim Declared |
Audited figures referenced from NTPC Annual Reports
.
9. Balance Sheet Strength and Solvency Metrics
NTPC’s capital-intensive operations are supported by long-term debt financing:
- Debt-to-Equity Ratio: Stands at ~1.30x to 1.40x, a conservative level for an infrastructure utility where generation assets are underpinned by 25-year Power Purchase Agreements.
- Credit Rating Profile: Domestic agencies CRISIL, ICRA, and CARE have reiterated their highest ‘AAA / Stable’ ratings on all long-term domestic debt and bond issuances.
- Working Capital Cycle: The Ministry of Power’s Late Payment Surcharge (LPS) rules have reduced state distribution utility overdue payments, keeping receivables within 45 to 60 days of billing.
10. Institutional Shareholding Profile
According to official shareholding filings on NSE India
:
- President of India (Government of India): 51.10% (Stable sovereign ownership; complies with statutory minimum public shareholding).
- Foreign Institutional Investors (FIIs): ~17.5% – 18.5% (High representation among global emerging-market infrastructure funds).
- Domestic Institutional Investors (DIIs): ~26.5% – 27.5% (Substantial long-term stakes held by Life Insurance Corporation of India and major domestic mutual fund houses).
- Public, Retail & High-Net-Worth Investors: ~3.5%.
11. Management Quality and Corporate Governance
NTPC is led by Chairman and Managing Director Gurdeep Singh, who has steered the utility since 2016 (NTPC Board Profiles
). Corporate governance practices feature a balanced board comprising functional executive directors, administrative ministry representatives, and independent energy specialists. Project procurement is conducted through transparent international and domestic competitive e-tendering adhering to Central Vigilance Commission guidelines.
12. Strategic Expansion Projects & Future Pipeline
Current ongoing capital initiatives include:
- Khavda Ultra Mega Renewable Park (Gujarat): Phased construction and commissioning of solar and wind generation blocks targeting multi-gigawatt operational scale.
- Supercritical Thermal Expansions: Constructing high-efficiency, lower-emission 800 MW supercritical units at Talcher, Singrauli, and Lara to replace aging subcritical capacity.
- Green Hydrogen and Carbon Capture Pilots: Commissioning CO2-to-methanol synthesis and green hydrogen blending pilot plants at the Vindhyachal complex.
- Pumped Storage Hydro Projects: Preparing detailed project reports and site engineering for over 5 GW of pumped storage hydro schemes.
13. Comprehensive Operational Risk Analysis
| Risk Category | Nature of Operational Exposure | Mitigation Strategy |
| Coal Supply Chain Disruptions | Monsoon water accumulation in open-cast mines or railway freight bottlenecks affecting fuel supply. | Increasing captive mine output, multi-locational coal sourcing, and maintaining mandatory 15-day coal stockpiles. |
| Counterparty DISCOM Fiscal Stress | Deterioration in state electricity board finances delaying monthly capacity billing recoveries. | Letters of Credit, payment security under the LPS framework, and the RBI tripartite recovery agreement. |
| Renewable Grid Curtailment | Delays in interstate transmission corridor commissioning causing temporary curtailment of solar or wind generation. | Co-locating renewable projects along designated Green Energy Corridors and building internal energy storage. |
| Environmental Regulatory Tightening | Capital requirements to retrofit Flue Gas Desulfurization (FGD) systems across older coal units. | CERC-approved Capex pass-through mechanisms that allow environmental retrofits to be capitalized into base tariffs. |
14. Educational Technical Overview
The chart readings detailed below reflect historical technical indicators for educational review and do not constitute price forecasts or investment recommendations.
| Indicator | Historical Observed Level | Educational Technical Context |
| Daily Relative Strength Index (RSI 14) | 49.2 | Positioned in the neutral zone (40–60), indicating balanced market momentum |
| 50-Day Exponential Moving Average (50-EMA) | Near ₹338 – ₹344 | Intermediate trend indicator monitored during market consolidation phases |
| 200-Day Exponential Moving Average (200-EMA) | Near ₹318 – ₹324 | Long-term moving average marking multi-month structural support |
| Historical Structural Support Zone | ₹312 – ₹320 | Prior base where domestic institutional accumulation previously emerged |
| Historical Structural Resistance Zone | ₹405 – ₹415 | Previous 52-week peak band where profit-taking occurred |
15. Illustrative Analytical Scenarios (Bull, Base, Bear)
These scenarios represent hypothetical analytical frameworks and must not be interpreted as financial forecasts or investment advice.
1. Accelerated Energy Transition Scenario
In an accelerated scenario, commissioning across the 35.7 GW construction pipeline proceeds ahead of schedule, expanding NGEL’s operational renewable fleet toward 20 GW. Coal availability incentives remain high as baseload thermal PLFs exceed 75%. Strong cash flows support dividend distributions, and the market accords higher valuation multiples to the green subsidiary.
2. Baseline Infrastructure Scenario
In a baseline scenario, annual electricity demand compounds at 6%–7%, allowing NTPC’s coal fleet to operate at 70%–72% PLF under CERC cost-plus norms. Clean energy capacity expands at 3–4 GW annually, and operating EBITDA margins remain stable near 30%–33%, delivering steady mid-single-digit net profit growth and a consistent ~2.7% dividend yield.
3. Slower Execution Scenario
In a slower execution scenario, equipment delivery bottlenecks and land acquisition delays defer planned commercial operation dates (CODs) for solar and wind projects. Capital work-in-progress expands without immediate tariff realization, while elevated maintenance expenses on aging subcritical units temporarily moderate operating margins to 26%–28%.
16. Qualitative Sentiment Analysis
- Institutional Sentiment:Constructive. Long-term institutional investors value NTPC for its earnings visibility, stable CERC regulatory framework, and reasonable valuation relative to private utilities.
- Sectoral Sentiment:Positive. Rising peak power demand across India reinforces the necessity of thermal baseload capacity alongside clean energy additions.
- Credit & Debt Market Sentiment:Favorable. Domestic and international bond investors treat NTPC paper as near-sovereign credit, enabling low-cost financing for ongoing capital expenditure.
17. Long-Term Business Outlook
NTPC’s strategic development over the coming decade will be driven by three core priorities:
- Maintaining its baseload thermal generation fleet to support national grid reliability during peak consumption hours.
- Expanding NTPC Green Energy Limited toward 60 GW of renewable energy capacity by 2032.
- Developing energy storage, nuclear generation, and pumped hydro assets to build a diversified, non-fossil round-the-clock power portfolio.
18. Key Takeaways
- September 12, 2026 Announcement: Declared commercial operation (COD) of the Vanki Wind Energy Project (6.3 MW part-capacity), pushing total group commercial capacity past the 90 GW milestone to 90,006 MW.
- Generation Scale: Generates approximately 24% of India’s electricity with ~17% of total installed national capacity.
- Steady Q1 FY27 Financials: Reported quarterly revenue of ₹51,141.51 crore and net profit of ₹6,721.05 crore (+11.8% YoY) with ~33.5% operating EBITDA margins.
- Regulated Return Mechanism: Operates under CERC cost-plus tariff structures, earning a guaranteed 15.5% post-tax return on equity and passing through fuel costs.
- Large Project Pipeline: Backed by an active construction pipeline of nearly 35.7 GW spanning thermal, solar, wind, and hydro assets.
- Valuation & Yield Profile: Trades at a trailing P/E of ~11.6x–13.6x with an equity dividend yield near 2.70%–2.73%.
- Sovereign Backing: 51.10% Government of India ownership provides high credit stability (AAA domestic ratings) and competitive borrowing rates.
19. Frequently Asked Questions (FAQs)
What was the key corporate announcement made by NTPC on September 12, 2026?
NTPC disclosed that its subsidiary, NTPC Green Energy Limited (NGEL), declared the Commercial Operation Date (COD) for the second part capacity of 6.3 MW of the Vanki Wind Energy Project in Gujarat, taking total NTPC Group installed capacity to 91,086 MW and commercial capacity to 90,006 MW.
What is the significance of the 90,000 MW milestone for NTPC?
Crossing 90,006 MW in commercial capacity reinforces NTPC’s position among the ten largest power generation utilities globally, providing operational scale benefits in fuel procurement, equipment sourcing, and capital financing.
How does NTPC make money on its thermal power stations?
Under Central Electricity Regulatory Commission (CERC) regulations, NTPC earns a two-part tariff: a fixed capacity charge that covers capital costs and delivers a guaranteed 15.5% post-tax return on equity, and an energy charge that directly passes through the cost of fuel to off-takers.
What is NTPC Green Energy Limited (NGEL)?
NTPC Green Energy Limited is a specialized subsidiary of NTPC focused on developing non-fossil energy assets, with commercial operational capacity exceeding 10.8 GW and a target to reach 60 GW by 2032.
What is NTPC’s dividend yield?
NTPC provides an annual dividend yield of approximately 2.70% to 2.75%, supported by predictable cash flows from regulated utility tariffs.
Who is the Chairman and Managing Director of NTPC?
Shri Gurdeep Singh serves as the Chairman and Managing Director (CMD) of NTPC Limited.
How much power does NTPC contribute to India’s national grid?
NTPC generates approximately 24% of India’s total electricity output while accounting for roughly 17% of the nation’s total installed power capacity.
What is NTPC’s Plant Load Factor (PLF)?
NTPC’s coal-based stations operate at an average Plant Load Factor exceeding 72%, significantly higher than the national thermal average (~63%–65%).
20. Company Snapshot Table
| Dimension | Corporate Details |
| Legal Company Name | NTPC Limited |
| NSE Ticker / BSE Scrip Code | NTPC / 532555 |
| Enterprise Status | Maharatna Public Sector Enterprise (PSE) |
| Administrative Ministry | Ministry of Power, Government of India |
| Chairman & Managing Director | Gurdeep Singh |
| Corporate Headquarters | NTPC Bhawan, SCOPE Complex, 7 Institutional Area, Lodhi Road, New Delhi 110003 |
| Official Corporate Website | ntpc.co.in |
| Total Group Installed / Commercial Capacity | 91,086 MW / 90,006 MW |
| Market Capitalization | ~₹3,19,505 Crore |
| Trailing Twelve Month P/E | ~11.64x – 13.60x |
| Consolidated ROCE / ROE | ~8.92% / 15.1% |
| Promoter Shareholding | 51.10% (President of India) |
21. Fundamental Analysis Summary
NTPC Limited remains the cornerstone of India’s electric power system:
- Utility Scale & Baseload Moat: Supplying roughly a quarter of India’s power output gives NTPC an indispensable role in maintaining grid frequency and meeting national peak power demand.
- Earnings Predictability: The CERC cost-plus framework shields core thermal profits from fuel price volatility, delivering steady regulated equity returns and healthy operating cash generation.
- Energy Transition Runway: Rapidly commercializing solar and wind assets through NTPC Green Energy Limited (reaching 10.8+ GW commercial scale) enables the company to diversify its portfolio while internally funding capital expenditures.
- Investment Profile: Represents a low-beta, dividend-yielding blue-chip utility combining baseload revenue stability with long-term exposure to India’s renewable energy expansion.
Disclaimer:
This content is for educational purposes only. Stock market investments are subject to market risks. The author is not a SEBI-registered investment advisor. Readers should do their own research or consult a certified financial advisor before trading.
Read Another Article
Stay updated on the latest Nifty 50 stock movements and corporate news with our detailed analyses:
SBI Life Stock Analysis 2026: Powerful Growth, Valuation & Outlook. read here