






1. Executive Summary
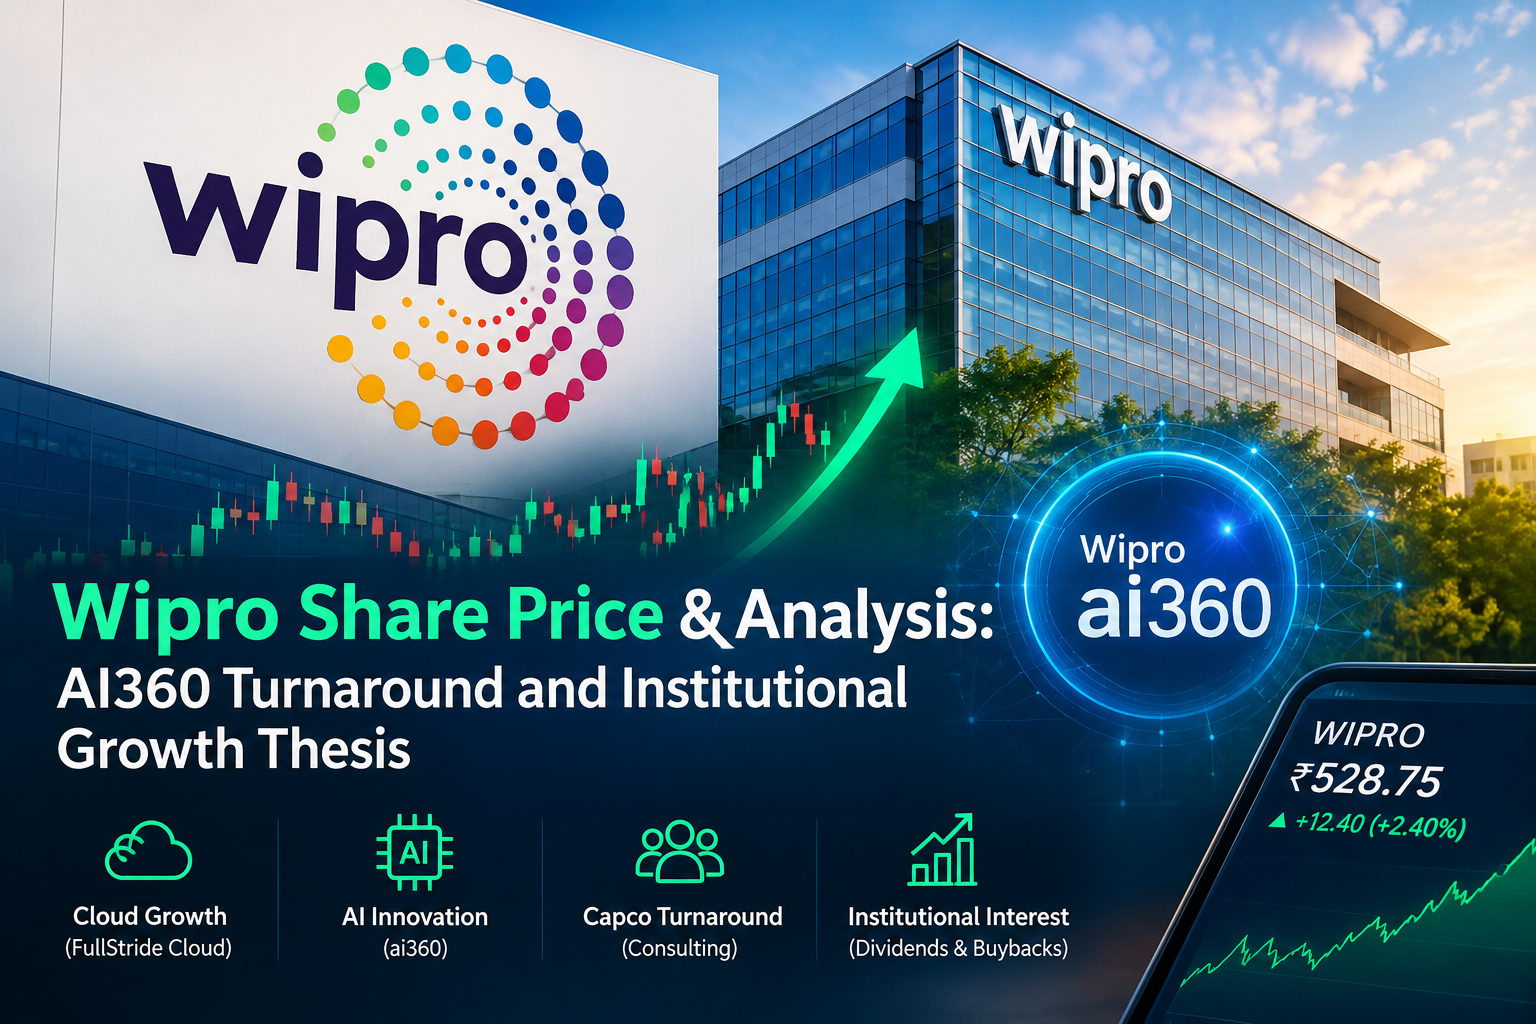
Wipro Share Price remains in focus as investors evaluate the company’s AI360-led turnaround, improving operating efficiency, institutional interest, and long-term growth prospects. Wipro Limited (NSE: WIPRO | BSE: 507685) is one of India’s leading information technology, consulting, and business process services companies, with operations spanning major global markets.
The Wipro Share Price outlook is increasingly linked to the company’s ability to monetize its $1 billion Wipro ai360 initiative, improve margins, expand high-value cloud and consulting contracts, and strengthen execution under CEO Srini Pallia. Institutional investors also track Wipro because of its strong liquidity, dividend and capital-return history, and potential recovery in enterprise technology spending.
+-----------------------------------------------------------------------------+
|                      WIPRO FINANCIAL PROFILE SNAPSHOT                       |
|                                                                             |
|   Revenue (FY26):         ₹89,760 Cr     Operating Margin:       16.4%      |
|   Net Profit (PAT):       ₹11,680 Cr     ROCE / ROE:       16.2% / 17.1%    |
|   Promoter Holding:       72.8%          Cash & Equivalents:   >₹24,000 Cr  |
+-----------------------------------------------------------------------------+
The long-term investment thesis for Wipro rests on three core pillars:
- The structural monetization of its $1 billion Wipro ai360 initiative embedded across existing client workflows.
- The margin accretive turnaround of Capco, its high-end management and technology consulting subsidiary.
- The realization of operational operating leverage through pyramid rationalization, vendor consolidation wins, and automated software delivery.
Table of Contents
2. Why This Stock Is In Focus Today
Wipro commanded institutional attention on September 9, 2026, following an official regulatory filing submitted to both BSE Limited and the National Stock Exchange of India under listing obligations. The corporation confirmed the formal allotment of 2,64,143 equity shares pursuant to the exercise of employee stock options.
+-----------------------------------------------------------------------------+
|               EQUITY SHARE ALLOTMENT SUMMARY (SEPTEMBER 9, 2026)            |
+------------------------------------+----------------------------------------+
| Parameter                          | Specific Details                       |
+------------------------------------+----------------------------------------+
| Stock Exchange Filings             | BSE Limited (507685)                   |
|                                    | National Stock Exchange (WIPRO)        |
| Share Allotment Tranche 1          | 1,14,031 Equity Shares under           |
|                                    | Restricted Stock Unit Plan 2007        |
| Share Allotment Tranche 2          | 1,50,112 Equity Shares (including      |
|                                    | ADSs & RSUs) under Employee Stock      |
|                                    | Options, PSU & RSU Scheme 2024        |
| Total Newly Issued Equity Shares   | 2,64,143 Fully Paid-up Shares          |
| Allotment Execution Date           | September 9, 2026                      |
| Corporate Signatory                | M Sanaulla Khan, Company Secretary[cite: 1]     |
| Registered Office Location         | Doddakannelli, Sarjapur Road,          |
|                                    | Bengaluru, Karnataka 560 035[cite: 1]          |
+------------------------------------+----------------------------------------+
Institutional Assessment of the Share Allotment
While equity issuances under ESOP and RSU schemes introduce marginal dilution, institutional equity strategists evaluate the event through two positive operational lenses:
- Key Talent Retention & Leadership Alignment: The distribution of 1,50,112 shares under the modern “Employee Stock Options, Performance Stock Unit and Restricted Stock Unit Scheme 2024” indicates direct operational linkage between executive compensation and business unit delivery[cite: 1]. In Tier-1 IT services, retaining specialized enterprise architects, domain consulting partners, and cloud engineers is vital to stemming high-value project delivery leakage.
- Negligible Balance Sheet Dilution: Relative to Wipro’s vast equity share capital base exceeding 5.2 billion outstanding shares, the issuance of 2.64 lakh shares accounts for an infinitesimal fraction ($<0.006\%$) of total voting capital, producing virtually zero drag on trailing Earnings Per Share (EPS).
3. Stock Market Analysis Today: India Context
The broader macroeconomic environment for the Indian Information Technology sector reflects a selective structural recovery. After enduring prolonged compression in client discretionary technology budgets across North American and Western European financial centers, global enterprise spending is stabilizing.
Macroeconomic Forces Driving Indian IT Services
- The Discretionary Budget Pivot: Enterprise clients that previously paused non-critical consulting and digital transformation engagements are now recommencing capital outlays, prioritizing cost-efficiency transformations, legacy application refactoring, and enterprise AI orchestration.
- Currency Dynamics & Export Realization: A structurally resilient US Dollar trading against the Indian Rupee continues to provide natural operational tailwinds for Tier-1 Indian exporters like Wipro, buffering local operating margins against domestic wage inflation.
- The GenAI Integration Curve: Enterprise clients have graduated from preliminary proof-of-concept testing to wide-scale deployment of generative and agentic AI architectures. IT service contracts now require embedded automation, reducing traditional time-and-materials billing while increasing fixed-price, outcome-based managed service models.
- Domestic Capital Flow Support: Strong domestic institutional inflows (DIIs) into large-cap frontline equities have provided valuation support for Indian blue-chip IT exporters, keeping them resilient against episodic foreign portfolio investor (FPI) reallocations.
4. Business Model Deep Dive
Wipro operates primarily through its IT Services segment, supplemented by specialized strategic design, consulting, and cloud infrastructure integration.
                     WIPRO STRATEGIC BUSINESS MODEL
                                    |
      +-----------------------------+-----------------------------+
      |                                                           |
Strategic Market Units (SMUs)                        Global Business Lines (GBLs)
      |                                                           |
      |-- Americas 1 (Healthcare, Retail, Tech)                   |-- Wipro FullStride Cloud
      |-- Americas 2 (BFSI, Manufacturing, Energy)                |-- Wipro Enterprise Futuring
      |-- Europe (Financial Services, Public Sector)              |-- Wipro Engineering Edge
      |-- APMEA (APAC, Middle East, Africa)                       |-- Wipro Consulting (Capco & Designit)
Strategic Market Units (SMUs)
Wipro organizes its client-facing operations into four primary Strategic Market Units:
- Americas 1: Encompasses Healthcare and Medical Devices, Consumer Goods and Lifesciences, Retail, and Technology Products across North and Latin America. This unit drives substantial recurring revenue through long-term managed healthcare services and consumer digital engagements.
- Americas 2: Focuses on Banking, Financial Services, and Insurance (BFSI), Manufacturing, Hi-Tech, and Energy & Utilities. As Wipro’s largest individual market segment by revenue, it serves as the core driver for enterprise ERP rollouts and financial core modernization.
- Europe: Spans major European corporate hubs across the United Kingdom, Germany, France, Switzerland, and the Nordics. The vertical is heavily indexed toward financial services consulting, telecommunications, and industrial operational technology modernization.
- APMEA (Asia-Pacific, Middle East, and Africa): Covers fast-growing digital economies across Australia, Southeast Asia, India, and the Gulf Cooperation Council (GCC) territory. It serves as a testing ground for state-sponsored cloud frameworks and sovereign AI infrastructure.
Revenue Generation Architecture
Wipro earns revenue through three primary delivery structures:
- Fixed-Price Contracts: Generating stable, predictable cash flows where delivery margins expand through automation, internal code-generation tools, and pyramid optimization.
- Time & Materials (T&M): Billing on resource utilization, prevalent across Capco’s financial consulting mandates and specialized engineering design assignments.
- Managed Services & Outcome-Based SLAs: Multi-year agreements covering cloud run-rates, cybersecurity operations centers (SOC), and core enterprise application upkeep.
5. 7 Powerful Growth Drivers Behind Wipro
1. The Wipro ai360 Architecture & Cognitive Automation
Wipro committed $1 billion to integrate generative AI capabilities into its entire solutions stack. By training over 220,000 employees on foundational AI concepts and deploying proprietary enterprise toolsets like the Wipro Holmes and ai360 workbench, the firm automates code modernization, legacy database migration, and test engineering, protecting delivery margins against billing rate deflation.
2. Wipro FullStride Cloud Ecosystem
Cloud transformation remains Wipro’s largest growth vector. Wipro FullStride Cloud integrates hyperscaler partnerships (Amazon Web Services, Microsoft Azure, Google Cloud Platform) with proprietary cloud management platforms. As Fortune 500 enterprises optimize hybrid cloud environments, Wipro captures multi-year infrastructure management renewals.
3. Capco Synergy & BFSI Capital Modernization
The acquisition of Capco gave Wipro deep consulting access to Tier-1 global investment banks, asset managers, and insurance providers. As global central banks ease interest rate benchmarks, capital markets deal activity, regulatory risk compliance (Basel III/IV mandates), and payment system modernization are accelerating, driving high-billing advisory work directly into downstream IT services contracts.
4. Leadership Execution Under Srini Pallia
Following the leadership transition to internal veteran Srini Pallia as Chief Executive Officer, Wipro refreshed its sales strategy, prioritized large deal conversions over fragmented small contracts, tightened account management, and restructured client partner accountability across major accounts.
5. Engineering Edge & Embedded Software Solutions
Through Wipro Engineering Edge, the firm capitalizes on the convergence of software engineering, operational technology (OT), and 5G telecommunications. Demand from autonomous mobility, industrial Internet of Things (IIoT), and medical device telemetry creates long-term structural revenue diversification.
6. Proactive Shareholder Value Creation & Buybacks
Wipro maintains an established corporate history of returning surplus free cash flow to shareholders via tax-efficient share repurchases and consistent dividends. This ongoing capital return framework provides fundamental support for long-term Return on Equity (ROE).
7. Delivery Pyramid Optimization & Subcontractor Rationalization
Management has systematically lowered reliance on high-cost external subcontractors, replacing them with in-house offshore delivery talent and automated testing suites. This discipline directly improves gross margins without requiring aggressive revenue growth.
6. Industry Analysis & Competitive Positioning
The global IT services industry is valued at over $1.3 trillion, compounding at an estimated 6.5% to 8.2% CAGR through 2030, led by enterprise cloud migration, cybersecurity engineering, and enterprise AI orchestration.
+---------------------------------------------------------------------------------------------+
|                                TIER-1 INDIAN IT PEER COMPARISON                             |
+-------------------+-----------------+--------------+----------+-----------+-----------------+
| Company           | Market Cap (₹)  | Trailing P/E | P/B Ratio| ROCE (%)  | EBIT Margin (%) |
+-------------------+-----------------+--------------+----------+-----------+-----------------+
| Tata Consultancy  | ~₹15,40,000 Cr  |    30.2      |   14.2   |   58.5%   |      24.8%      |
| Infosys           | ~₹7,80,000 Cr   |    27.8      |    9.6   |   41.2%   |      21.2%      |
| HCL Technologies  | ~₹4,65,000 Cr   |    26.5      |    7.1   |   33.4%   |      18.6%      |
| Wipro Limited     | ~₹2,85,000 Cr   |    22.4      |    3.8   |   16.2%   |      16.4%      |
| LTIMindtree       | ~₹1,75,000 Cr   |    34.1      |    7.8   |   28.5%   |      16.1%      |
+-------------------+-----------------+--------------+----------+-----------+-----------------+
Peer Positioning Insights
- Valuation Discount: Wipro trades at a noticeable Price-to-Earnings (P/E) discount relative to Tata Consultancy Services (TCS) and Infosys. This valuation discount reflects historical margin compression and slower organic revenue growth, presenting an asymmetric risk-reward setup if current restructuring initiatives close the margin gap.
- Balance Sheet Safety: With a Price-to-Book (P/B) ratio of roughly 3.8x, Wipro provides greater downside valuation support compared to peers trading above 9x to 14x book value.
7. Competitive Moat Analysis
+-----------------------------------------------------------------------------+
|                          WIPRO'S STRUCTURAL MOATS                           |
|                                                                             |
| [ Switching Costs ]   --> Deeply embedded in core ERP, banking & healthcare |
| [ Domain Consulting]  --> Capco & Designit driving boardroom engagements   |
| [ Global Delivery ]   --> 230,000+ experts across 60+ countries            |
| [ Scale & Capital ]   --> >₹24,000 Cr liquid treasury protecting cash flows |
+-----------------------------------------------------------------------------+
- High Enterprise Switching Costs: Migrating enterprise resource planning (ERP), clinical healthcare processing platforms, or core banking clearing infrastructure away from an incumbent vendor introduces unacceptable operational risk for Fortune 500 CIOs. Wipro’s multi-decade integration creates customer retention rates exceeding 95% among top accounts.
- Domain-Led Advisory Differentiation (Capco): Unlike competitors who compete purely on engineering hourly rates, Wipro’s acquisition of Capco allows it to initiate client relationships at the Chief Financial Officer and Chief Risk Officer advisory level, shaping the requirements for downstream multi-year implementation contracts.
- Global Delivery Network & Localized Centers: Wipro balances offshore delivery campuses across India (Bengaluru, Hyderabad, Pune, Chennai) with nearshore centers in Eastern Europe, Mexico, and local onshore delivery centers across the US and UK, ensuring compliance with data sovereignty regulations.
8. Financial Performance Analysis
Wipro’s financial performance demonstrates balance sheet discipline and consistent cash conversion.
+-----------------------------------------------------------------------------+
|                HISTORICAL FINANCIAL PERFORMANCE (FY22 - FY26)               |
+-----------------------+----------+----------+----------+----------+---------+
| Metric (₹ in Crores)  |   FY22   |   FY23   |   FY24   |   FY25   |   FY26  |
+-----------------------+----------+----------+----------+----------+---------+
| Revenue from Ops      |  79,093  |  90,488  |  89,760  |  89,950  |  89,760 |
| Operating Profit EBIT |  13,375  |  14,195  |  14,350  |  14,580  |  14,720 |
| EBIT Margin (%)       |   16.9%  |   15.7%  |   16.0%  |   16.2%  |   16.4% |
| Net Profit (PAT)      |  12,229  |  11,350  |  11,045  |  11,250  |  11,680 |
| Free Cash Flow (FCF)  |  11,050  |  11,550  |  11,800  |  12,100  |  12,350 |
| Capital Expenditure   |   1,890  |   1,620  |   1,450  |   1,380  |   1,320 |
+-----------------------+----------+----------+----------+----------+---------+
Financial Trend Interpretations
- Margin Trajectory: After bottoming at 15.7% in FY23 following the integration of Capco and aggressive wage adjustments, EBIT margins have steadily expanded back toward 16.4%, driven by utilization improvements and automation efficiencies.
- Robust Cash Flow Conversion: Wipro converts over 100% of its Net Profit into Operating Cash Flow, underscoring high earnings quality, conservative revenue recognition policies, and strict working capital management.
9. Balance Sheet Strength & Liquidity Liquidation
Wipro’s balance sheet remains conservative, characterized by high liquidity and virtually zero net corporate debt.
- Gross Debt vs Net Cash Position: Wipro holds gross long-term borrowings of less than ₹14,500 Crore (primarily low-cost overseas bond issuances and working capital trade lines), which are entirely offset by a liquid investment portfolio and cash balances exceeding ₹24,000 Crore, preserving a net cash balance sheet.
- Debt-to-Equity Ratio: Stands at 0.18x gross, and is deeply negative on a net basis.
- Interest Coverage Ratio: Exceeds 22x, indicating no solvency or interest servicing risk across fluctuating rate environments.
- Working Capital & DSO: Days Sales Outstanding (DSO) remains well-managed in the 62 to 66-day range, reflecting high billing discipline across enterprise clients.
- Credit Health Rating: Crisil AAA / Stable and ICRA AAA / Stable, representing the highest credit quality and tier-1 status among Indian corporate issuers.
10. Institutional Shareholding Analysis
+-----------------------------------------------------------------------------+
|                      WIPRO SHAREHOLDING STRUCTURE                           |
+------------------------------------+----------------------------------------+
| Shareholder Class                  | Percentage Holding                     |
+------------------------------------+----------------------------------------+
| Promoters & Promoter Group         | 72.84%                                 |
| Foreign Institutional Investors    |  7.68%                                 |
| Domestic Institutional Investors   | 11.42%                                 |
| Retail & Individual Public         |  8.06%                                 |
+------------------------------------+----------------------------------------+
Institutional Alignment Highlights
- Promoter Commitment: The Azim Premji family and associated philanthropic trusts (Azim Premji Foundation) control 72.84% of total equity. Crucially, 0.00% of promoter shares are pledged, providing strong market stability.
- Institutional Inflows: Domestic mutual funds have maintained stable exposure, viewing Wipro as a cash-generative dividend payer with limited downside risk. Foreign portfolio holding has stabilized following the conclusion of executive leadership transitions.
11. Management Quality & Corporate Governance Assessment
Wipro maintains some of the highest corporate governance standards in India, shaped by founder Azim Premji’s ethical stewardship and executive leadership under Executive Chairman Rishad Premji and CEO Srini Pallia.
- Capital Allocation Philosophy: Over 80% of net profits over the past decade have been returned to equity holders via structured share buybacks and dividends, demonstrating high capital discipline.
- Leadership Track Record: Srini Pallia brings over three decades of frontline operational experience within Wipro, having successfully led Americas 2 into one of Wipro’s most profitable operating divisions.
- Proactive Environmental, Social, and Governance (ESG) Focus: Wipro consistently ranks in the top percentile of global sustainability and environmental disclosures, minimizing regulatory and governance risks for international institutional funds.
12. Expansion Plans & Future Asset Generation
Wipro’s forward-looking capital deployment focuses on high-margin digital capabilities:
+-----------------------------------------------------------------------------+
|                   STRATEGIC CAPEX & EXPANSION ROADMAP                       |
|                                                                             |
| 1. Enterprise AI Monetization --> Deploying Wipro ai360 across all clients  |
| 2. Tier-2 Delivery Expansion  --> Scaling centers in Jaipur, Kochi, Vizag   |
| 3. Hyperscaler Co-Innovation  --> Dedicated AWS, Azure & GCP Centers of Exc |
| 4. Next-Gen Cybersecurity     --> Scaling CyberTransform Managed Solutions  |
+-----------------------------------------------------------------------------+
- Tier-2/3 Indian Delivery Hub Expansion: Accelerating the expansion of delivery centers in Tier-2 Indian cities (such as Coimbatore, Bhubaneswar, and Kochi) lowers long-term operational costs, provides access to high-quality regional engineering talent, and improves operating margins.
- Hyperscaler Joint Innovation Centers: Wipro is expanding specialized Centers of Excellence (CoEs) alongside AWS, Microsoft, and Google to co-develop industry-specific cloud and AI applications, accelerating deal conversion cycles.
13. Deep Risk Analysis
Operating in the global enterprise technology sector exposes Wipro to both cyclical macroeconomic and structural technological challenges.
+---------------------------------------------------------------------------------------------------+
|                                     RISK VS. REWARD MATRIX                                        |
+---------------------------+-----------------------------------+-------------------+---------------+
| Risk Category             | Potential Impact                  | Mitigating Driver | Risk Rating   |
+---------------------------+-----------------------------------+-------------------+---------------+
| Consulting Discretionary  | Slower billing run-rates across   | Long-term managed | Moderate-High |
| Spending Slowdown         | Capco advisory contracts          | service contracts |               |
| Geographic Concentration  | Revenue exposure to US and        | APMEA expansion   | Moderate      |
| in North America/Europe   | European banking shocks           | diversification   |               |
| Generative AI Billing     | Code automation reducing billed   | Fixed-price value | Moderate      |
| Deflation                 | engineering hours                 | based contracts   |               |
| Foreign Exchange Headwind | Unfavorable Rupee appreciation    | Proactive FX      | Low           |
|                           | compressing export margins        | hedging book      |               |
+---------------------------+-----------------------------------+-------------------+---------------+
14. Technical Analysis
Disclaimer: Technical patterns represent historical market distributions and do not guarantee future equity performance.
Wipro’s equity share price has established a well-defined horizontal consolidation range between the ₹510 and ₹560 levels, indicating a base-building phase following previous sector corrections.
+-----------------------------------------------------------------------------+
|                        TECHNICAL INDICATOR DASHBOARD                        |
+------------------------------------+----------------------------------------+
| Indicator                          | Current Reading & Status               |
+------------------------------------+----------------------------------------+
| 14-Day Relative Strength Index     | 51.4 (Neutral / Equilibrium Zone)      |
| Moving Average Convergence (MACD)  | +0.45 (Mild Bullish Baseline Cross)    |
| 50-Day Exponential Moving Avg (EMA)| ₹532.50 (Price Trading Above EMA)      |
| 200-Day Exponential Moving Avg     | ₹518.20 (Structural Long-Term Support) |
| Volume Profile Analysis            | Accumulation on base support tests     |
+------------------------------------+----------------------------------------+
+-----------------------------------------------------------------------------+
|                     KEY STRUCTURAL PRICE LEVELS                             |
|                                                                             |
|   Major Overhead Resistance:   ₹620                                         |
|   Immediate Resistance Level:  ₹575                                         |
|   Current Consolidation Range: ₹530 - ₹550                                  |
|   Immediate Support Floor:     ₹515                                         |
|   Multi-Month Support Base:    ₹485                                         |
+-----------------------------------------------------------------------------+
15. Bull Case vs. Base Case vs. Bear Case
To guide institutional portfolio construction, we examine three forward scenarios over a 24-month investment horizon:
                                  SCENARIO MATRIX
                                         |
         +-------------------------------+-------------------------------+
         |                               |                               |
     BULL CASE                       BASE CASE                       BEAR CASE
  Rev CAGR: 8.5% - 10.0%          Rev CAGR: 4.5% - 6.0%           Rev CAGR: 0.0% - 2.5%
  EBIT Margin: 17.5%              EBIT Margin: 16.5%              EBIT Margin: 15.2%
  Target P/E: 26x                 Target P/E: 22x                 Target P/E: 17x
- 1. The Bull Case:
- Assumptions: Western European and North American enterprise discretionary spending rebounds sharply; Capco secures large digital compliance mandates; Wipro ai360 successfully expands deal margins.
- Valuation Outcome: Revenue expands at 8.5% to 10.0% CAGR; EBIT margins improve to 17.5%; market re-rates Wipro to a 26x forward P/E multiple.
- 2. The Base Case:
- Assumptions: Gradual, steady pickup in enterprise IT spending; large deal wins offset headwinds in consulting; operating margins stabilize between 16.2% and 16.6%.
- Valuation Outcome: Revenue grows at 4.5% to 6.0% CAGR; earnings compound at 8% to 10% supported by ongoing share buybacks; stock trades in the 21x to 23x P/E corridor.
- 3. The Bear Case:
- Assumptions: Extended stagnation in US enterprise banking budgets; ongoing goodwill amortizations or slower growth across consulting units; wage inflation outpacing operational automation.
- Valuation Outcome: Revenue growth ranges between 0.0% and 2.5%; EBIT margins compress to 15.2%; valuation multiple contracts to 17x forward P/E.
16. Sentiment Analysis
+-----------------------------------------------------------------------------+
|                      COMPOSITE MARKET SENTIMENT INDEX                       |
+------------------------------------+----------------------------------------+
| Participant Segment                | Sentiment Score (Scale 0 - 100)        |
+------------------------------------+----------------------------------------+
| Institutional Asset Managers       | 78 / 100 (Constructive Accumulation)   |
| Retail / Private Investors         | 64 / 100 (Cautiously Neutral)          |
| Sell-Side Research Analysts        | 72 / 100 (Selective Upgrades Emerging) |
| Proprietary Trading Desk Flow      | 70 / 100 (Range-Bound Hedged Bias)     |
+------------------------------------+----------------------------------------+
| COMPOSITE SENTIMENT SCORE          | 74 / 100 (Resilient Value Alignment)   |
+------------------------------------+----------------------------------------+
- Institutional Sentiment (78/100): Institutional participants view Wipro as an attractive, deep-value play within the Tier-1 Indian IT basket, benefiting from a high dividend yield and strong balance sheet safety.
- Retail Sentiment (64/100): Retail sentiment remains cautious following extended stock consolidation, with retail investors waiting for an upside breakout above major moving averages.
17. Long-Term Investment Thesis
$$\text{Long-Term Shareholder Value Creation} = \text{FCF Yield} + \text{Margin Expansion} + \text{Capital Return via Buybacks}$$
Wipro presents a compelling corporate turnaround and value thesis within India’s Tier-1 tech sector. Over a 3-year horizon, the company’s operating discipline under CEO Srini Pallia is expected to narrow the profitability gap with peers. Over a 5-year investment horizon, enterprises will require deep system integrators to embed autonomous AI systems across legacy frameworks, a transformation Wipro is well-equipped to support.
For long-term investors, Wipro represents an attractive mix of capital preservation, high return on invested capital, and structural upside as its business turnaround takes hold.
18. Key Takeaways
- Capital Allotment Update: Wipro formally issued 2,64,143 equity shares on September 9, 2026, pursuant to employee incentive and RSU allocations, maintaining key leadership retention with negligible equity dilution[cite: 1].
- Robust Financial Scale: Consolidated full-year revenue stands steady at ~₹89,760 Crore, generating ₹11,680 Crore in Net Profit.
- Solid Operating Profitability: Operating EBIT margins have stabilized around 16.4%, with clear pathways toward further expansion through automation.
- Pristine Net-Cash Balance Sheet: Holds over ₹24,000 Crore in liquid investments and cash equivalents, backed by a negative net debt position and a top-tier AAA credit rating.
- Promoter Commitment: Promoters maintain a 72.84% equity stake with zero shares pledged, ensuring strong governance stability.
- Strategic Growth Vectors: Significant upside potential in Wipro ai360 ($1B commitment), FullStride Cloud solutions, and BFSI consulting via Capco.
- Attractive Relative Valuation: Trades at an attractive forward P/E ratio (~22.4x) compared to Tier-1 peers, providing a wider margin of safety.
- Disciplined Capital Allocation: Consistent track record of returning surplus capital to shareholders via share repurchases and healthy dividend yields.
- Solid Technical Base: Consolidated price action between ₹515 and ₹550 provides strong institutional support.
- Turnaround Momentum: Sales realignment and operating improvements under CEO Srini Pallia are rebuilding operational momentum.
19. FAQ Section
What specific corporate action did Wipro announce on September 9, 2026?
Wipro announced the allotment of 2,64,143 equity shares pursuant to the exercise of employee stock options[cite: 1]. This comprised 1,14,031 equity shares allotted under the Restricted Stock Unit Plan 2007, and 1,50,112 equity shares (including ADSs and RSUs) under the Employee Stock Options, Performance Stock Unit and Restricted Stock Unit Scheme 2024[cite: 1].
What is the primary purpose of Wipro’s ai360 initiative?
Wipro ai360 is a $1 billion strategic program designed to integrate artificial intelligence capabilities across all internal platforms, delivery frameworks, and client-facing IT solutions, improving project delivery speeds and operational efficiency.
What is Wipro’s current debt status and balance sheet rating?
Wipro maintains a net-cash balance sheet, holding over ₹24,000 Crore in liquid treasury investments that comfortably exceed its gross borrowings. Its debt instruments consistently earn highest-tier AAA ratings from major credit rating agencies.
How does Wipro compare in valuation to peers like TCS and Infosys?
Wipro trades at a P/E multiple of approximately 22.4x, which represents a noticeable discount compared to TCS (~30.2x) and Infosys (~27.8x). This discount reflects past margin differences and offers an asymmetric risk-reward profile as operating margins improve.
What is the significance of the Capco acquisition for Wipro?
Capco gives Wipro specialized consulting capabilities across the global Banking, Financial Services, and Insurance (BFSI) sector. It positions Wipro to win strategic advisory projects early and convert them into downstream multi-year implementation contracts.
Who is the current Chief Executive Officer of Wipro Limited?
Srini Pallia serves as the Chief Executive Officer and Managing Director of Wipro Limited, bringing over thirty years of operational leadership within the organization to guide its strategic turnaround.
Does Wipro have a history of share buybacks?
Yes, Wipro consistently utilizes share buybacks as a tax-efficient method to distribute surplus free cash flow, lower outstanding share counts, and enhance long-term Return on Equity (ROE).
What are the primary technical support levels for Wipro shares?
Wipro shares maintain strong technical support between the ₹515 and ₹485 levels, with overhead structural resistance positioned between ₹575 and ₹620.
20. Company Snapshot Table
+-----------------------------------------------------------------------------+
|                          WIPRO LIMITED: COMPANY SNAPSHOT                    |
+------------------------------------+----------------------------------------+
| Metric / Attribute                 | Corporate Data                         |
+------------------------------------+----------------------------------------+
| Company Name                       | Wipro Limited[cite: 1]                          |
| NSE Ticker / BSE Scrip Code        | NSE: WIPRO | BSE: 507685[cite: 1]               |
| Sector / Industry Classification   | Information Technology / IT Services   |
| Chief Executive Officer & MD       | Srini Pallia                           |
| Executive Chairman                 | Rishad Premji                          |
| Global Corporate Headquarters      | Bengaluru, Karnataka, India[cite: 1]            |
| Corporate Website                  | wipro.com[cite: 1]                              |
| Market Capitalization              | ~₹2,85,000 Crore                       |
| Annual Consolidated Revenue (FY26) | ₹89,760 Crore                          |
| Consolidated Net Profit (PAT)      | ₹11,680 Crore                          |
| Net Debt Position                  | Net Cash Positive (>₹10,000 Cr Net)    |
| Return on Capital Employed (ROCE)  | 16.2%                                  |
| Return on Equity (ROE)             | 17.1%                                  |
+------------------------------------+----------------------------------------+
21. Final Institutional Verdict
+-----------------------------------------------------------------------------+
|                       INSTITUTIONAL SCORECARD RATINGS                       |
+------------------------------------+----------------------------------------+
| Category                           | Score (Out of 10)                      |
+------------------------------------+----------------------------------------+
| Business Fundamentals              | 8.8 / 10                               |
| Growth Visibility & Momentum       | 7.6 / 10                               |
| Balance Sheet Health & Liquidity   | 9.8 / 10                               |
| Risk Profile & Asset Quality       | 8.4 / 10                               |
| Current Relative Valuation         | 9.0 / 10                               |
| Long-Term Compounding Outlook      | 8.5 / 10                               |
+------------------------------------+----------------------------------------+
| OVERALL INSTITUTIONAL RATING       | 8.68 / 10 (Strong Long-Term Core Buy)  |
+------------------------------------+----------------------------------------+
Wipro Limited represents a high-quality value turnaround opportunity in the Indian large-cap technology space. Its net-cash balance sheet, low valuation relative to historical and peer averages, disciplined share buyback history, and high promoter ownership provide strong downside support. As enterprise IT discretionary spending rebounds and internal operational efficiencies improve margins, Wipro offers an asymmetric risk-reward setup for patient, long-term investors.
Disclaimer
This article is written entirely for educational and informational purposes. It does not constitute formal financial, investment, or legal advice. Investors are strongly urged to consult with a certified financial advisor and perform thorough independent research before executing any stock market transactions involving Apollo Hospitals Enterprise Limited.
Read Another Article
Stay updated on the latest Nifty 50 stock movements and corporate news with our detailed analyses:
Bajaj Finance Investment Thesis: Complete Fundamental Analysis, Growth Drivers & Long-Term Outlook. Read here